How does vegetation structure and composition change with succession to a dominant woodland canopy?
There is a strong inverse relationship between the tree overstory and understory including shrubs and perennial grasses and forbs. Shrubs rarely persist beneath a closed tree canopy, especially sagebrush. However, deep rooted perennial grasses have been observed to persist where soils are moderately deep to deep and where restrictive layers (e.g. clay accumulation layer called an argillic), are absent or weakly developed.
Phase I, II, III—In Phase I, trees are present, but shrubs and herbs are the dominant vegetation influencing ecological processes on the site. In Phase II, trees are codominant with shrubs and herbs and all three vegetation layers influence ecological processes. In Phase III, trees are the dominant vegetation on the site and the primary plant layer influencing ecological processes (from Miller et al. 2005). Phases can be quantified using perennial cover to calculate a total tree dominance index (TDI) (Williams et al. 2017).
Tree dominance index (TDI) is a quantitative measure of the relative dominance of conifers based on the proportion of tree canopy cover to the summation of shrub and perennial grass (or herb) cover and is calculated as follows: Tree cover / (tree + shrub + tall perennial grass cover)
- Phase I = total tree / total tree + shrub + perennial grass = less than 0.34 (tree cover less than one-third)
- Phase II = total tree / total tree + shrub + perennial grass = 0.34–0.67 (tree cover one-third to two-thirds)
- Phase III = total tree / total tree + shrub + perennial grass = more than 0.67 (tree cover more than two-thirds)
For example, TDI = 0.67 occurs when tree canopy is twice that of perennial grasses and shrubs (Roundy et al. 2014). Tree cover can vary widely with both phase and TDI, depending on ecological site characteristics (Williams et al. 2017)
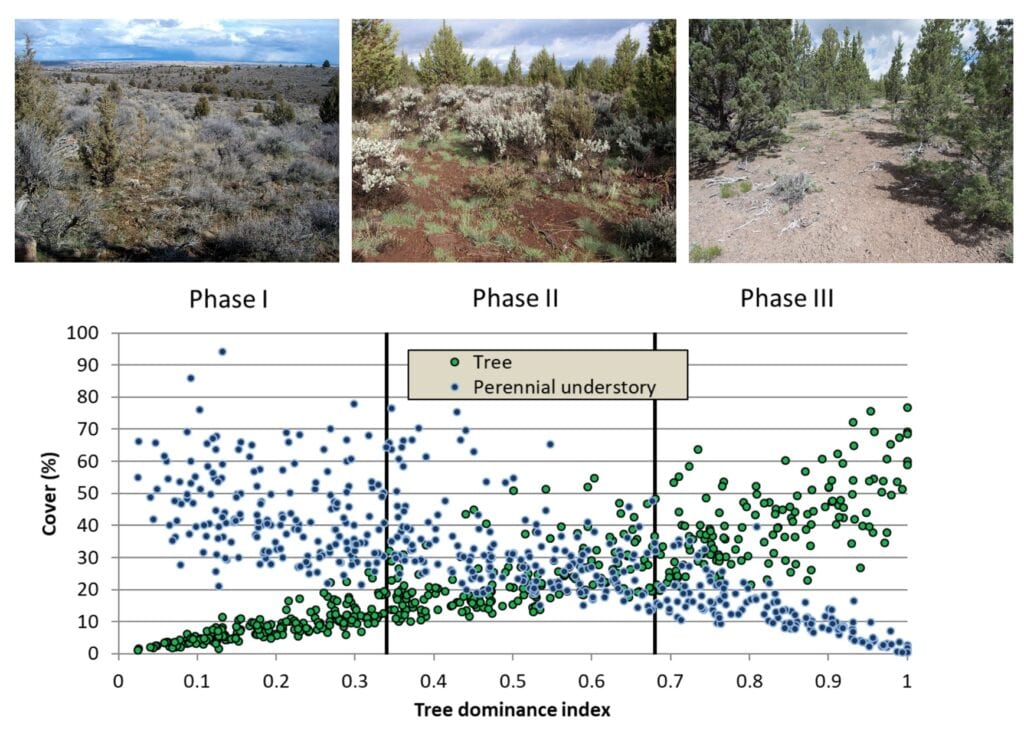
Figure from Miller et al. 2019, see pg. 49 & 275.